Эх өгүүлэл · English
Abstract
In this paper we have studied the possibility of determining the forms of uranium ions and minerals dissolved in water by using the Pourbaix diagram. Uranium in water with low uranium content exists in the form of uraninite or uranium dioxide UO2+ and with higher uranium content in the form of ions UO2(CO3)22. By selecting carbonate minerals and calculating the saturation index, it is shown that uranium in the water of Eastern region of Mongolia dissolved in the forms of minerals such as quartzite CaMgUO2(CO3)3(H2O)12, andersonite (Na2CaUO2(CO3)3(H2O)6), bayleyite (Mg2UO2(CO3)3(H2O)18), liebigite (Ca2UO2(CO3)3(H2O)10) .
Keywords: water, uranium, correlation, Piper,. Pourbaix diagram, uranium minerals.
Method and study area
Typical spectroscopic and chemical analysis techniques determine only the elemental compositions of the substances. However, the structural information of the chemical compound is determined by the molecular spectroscopic methods such as Raman spectroscopy and slow neutron scattering. In this paper, we discuss about a non-instrumental method to determine uranium compounds in water. The method is known as a Pourbaix diagram that maps out possible equilibrium states of a thermodynamic system consisting of ions, molecules, crystals and, metals in the solvent. Pourbaix diagram shows a dependence between oxidation and reduction potential (ORP or E-h) and the water pH. In other words, it shows the possible equilibrium phases of a system in the given pH and oxidation and reduction values. The diagram can be drawn for each indiviual elements. However, it depends on temperature, pressure metal binding agent (ligands) concentration in the solution that correlated by Nernst equation. Ligands are determined by general physico-chemical characteristics and major-ion analysis of the water. General physico-chemical characteristics of water includes pH, temperature, electrical conductivity (EC), oxidation and reduction potential (ORP), total dissolved solids (TDS), dissolved oxygen (DO). The main ion analysis can effectively be shown with Durov and Pipers diagram.
The Pourbaix diagram shows only the thermodynamical equilibrium states of the solutions, yet has no information of the metastable states. To estimate the metastable forms of uranium in water, we took into account the hydrolysis of 4 valence uranium ion and metastale bonds between uranyl ion, UO22+, and carbonate, chloride and sulfates. Moreover, we calculated uranium-ion correlation.
We studied groundwater samples of Dornogovi (DG) and Sukhbaatar (SB) aimag where uranium content is relatively high. The results of the measurements are shown in the figures 1-4. The diagram indicates the water samples of Dornogovi aimag is more alkaline and for Sukhbaatar aimag it is more acidic (Fig.1).
Figures and correlation tables
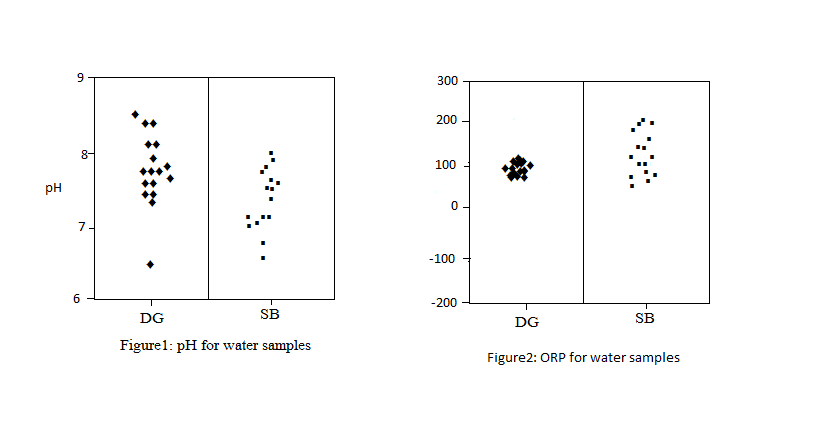
Figure 1: Water pH for samples of Dornogovi (DG) and Sukhbaatar (SB) aimags.
Figure 2: Oxidation and reduction potential (E-h) for samples of Dornogovi and Sukhbaatar aimags
From the diagram we see that E-h scattering range for the samples of Dornogovi aimag is narrow and while it is wider for samples of Sukhbaatar aimag.
Figures 3 and 4 show the results of major ions in water using by Durov diagram.
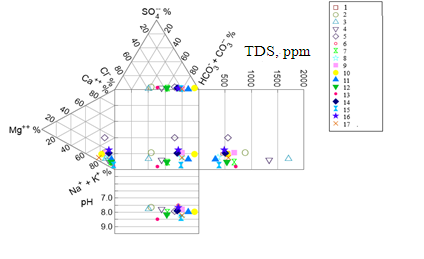
Figure 3: Durov diagram for water samples of Dornogovi aimag
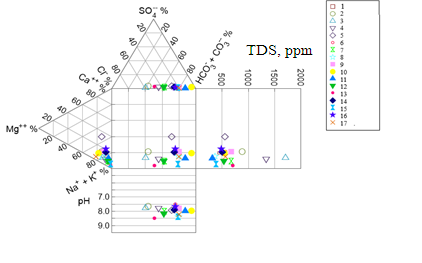
Figure 4: Durov diagram for water samples of Sukhbaatar aimag
From the diagrams it illustrates that ion content of the water samples of two aimags are almost same and Na and K ions among the cations and hydrocarbobate ions among the anions prevail. In the Tables 1 to 4 the correlation coefficient for uranium- physicochemical characteristics and uranium – major ions are showed for two selected aimags.
Table 1: Correlation for uranium and physico-chemical characteristics of water samples of Dornogovi aimag
| U | pH | EC | TDS | ORP | DO |
|---|---|---|---|---|---|---|
U | 1 | |||||
pH | 0.02 | 1 | ||||
EC | 0.136 | 0.14 | 1 | |||
TDS | 0.111 | 0.118 | 0.968 | 1 | ||
ORP | -0.168 | -0.134 | 0.205 | 0.408 | 1 | |
DO | 0.056 | 0.078 | -0.156 | -0.313 | -0.654 | 1 |
rxy(0.05:24)=0.381 | ||||||
Table 2: Correlation for uranium and major ions of water samples of Dornogovi aimag.
| U | HCO3- | Hardness | Ca2+ | Cl- | Mg2+ | SO42- |
|---|---|---|---|---|---|---|---|
HCO3 | 0.077 | 1 | |||||
Hardness | 0.171 | 0.610 | 1 | ||||
Ca2+ | 0.227 | 0.555 | 0.441 | 1 | |||
Cl- | 0.026 | -0.000 | -0.515 | 0.287 | 1 | ||
Mg2+ | 0.172 | 0.465 | 0.641 | 0.477 | -0.282 | 1 | |
SO42- | -0.022 | 0.170 | -0.603 | 0.195 | 0.837 | -0.204 | 1 |
rxy=(0.05:23)=0.423 |
Table 3: Correlation for uranium and physico-chemical characteristics of water samples of Sukhbaatar aimag
pH | EC | TDS | ORP | Do | Uranium | |
|---|---|---|---|---|---|---|
pH | 1 | |||||
EC | 0.096 | 1 | ||||
TDS | 0.092 | 0.999 | 1 | |||
ORP | 0.033 | -0.195 | -0.199 | 1 | ||
DO | 0.021 | -0.050 | -0.034 | -0.021 | 1 | |
Uranium | -0.209 | 0.483 | 0.490 | -0.458 | -0.137 | 1 |
rxy = (0.05, 14) = 0.480
Table 4: Correlation for uranium and major ions of water samples of Sukhbaatar aimag.
HCO3- | Hardness | Cl- | SO42- | NH4+ | NO2- | NO3- | Uranium | |
|---|---|---|---|---|---|---|---|---|
HCO3- | 1 | |||||||
Hardness | 0.481 | 1 | ||||||
Cl- | 0.626 | 0.658 | 1 | |||||
SO42- | 0.558 | 0.599 | 0.922 | 1 | ||||
NH4+ | 0.398 | 0.713 | 0.576 | 0.403 | 1 | |||
NO2- | -0.549 | -0.096 | -0.186 | -0.138 | -0.397 | 1 | ||
NO3- | 0.147 | 0.385 | 0.268 | 0.188 | 0.347 | -0.031 | 1 | |
Uranium | 0.634 | 0.562 | 0.480 | 0.452 | 0.232 | -0.329 | -0.074 | 1 |
rxy = (0.05, 14) = 0.480
Results and interpretation
The tables show that uranium in water of Dornogovi aimag has not any correlation with physico-chemical characteristics and major ions. However, uranium in water of Sukhbaatar aimag is positively correlated with EC, TDS and weakly negative correlated with E-h. Also, uraniumin in water positively correlated with hydrocarbonate and chloronium ions in case of Sukhbaatar. Based on the above mentioned remarks we have built a Pourbaix diagram for 2 samples, one of these with low uranium content (2ppb) and second is higher uranium content (212ppb). Pourbaix diagrams are shown in Figure 5 and 6. Crossed perpendicular line in the diagrams show corresponding value of pH and E-h for selected samples. The Pourbaix diagram show that the uranium in water, with low uranium content can be exist in the form of uraninite (UO2) and the uranium in water, with higher uranium content exist in the form of UO2(CO3)22 ions.
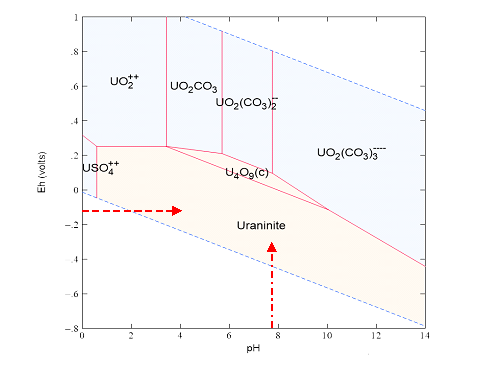
Figure 5: Pourbaix diagram of the sample with low uranium content
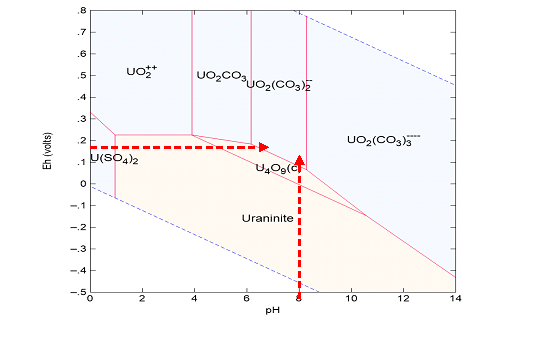
Figure 6: Pourbaix diagram of the sample with higher uranium content
Further we studied which cations can be reacted with UO2(CO3)22 uranium ions dissolved in the water. Saturation index was calculated using Geochemist Workbench program. By selecting carbonate minerals and calculating the saturation index we have predicted that the uranium in water can be dissolved in the forms of quartzite CaMgUO2(CO3)3(H2O)12, andersonite (Na2CaUO2(CO3)3(H2O)6), bayleyite (Mg2UO2(CO3)3(H2O)18) and liebigite (Ca2UO2(CO3)3(H2O)10).
References
Tsookhuu. Kh., Bolormaa. O, Tegshbayar. N, “Uranium concentration in drinking waters of Mongolia”, NUM J. Science, Physics Journal, 2017, No 25(478), Улаанбаатар, хууд. 116-132.
Pourbaix, M., Atlas of electrochemical equilibria in aqueous solutions. 2d English ed. 1974, Houston, Tex.: National Association of Corrosion Engineers.
P. Ravikumar, “Elixir Earth Sci. 80 31073-31077,” A comparative study on usage of Durov and Piper diagrams to interpret, pp. 4-5, 2015.
Piper, A.M. (1953). A Graphic Procedure in the Geochemical Interpretation of Water Analysis. Washington D.C.: United States Geological Survey. OCLC 37707555. ASIN B0007HRZ36.